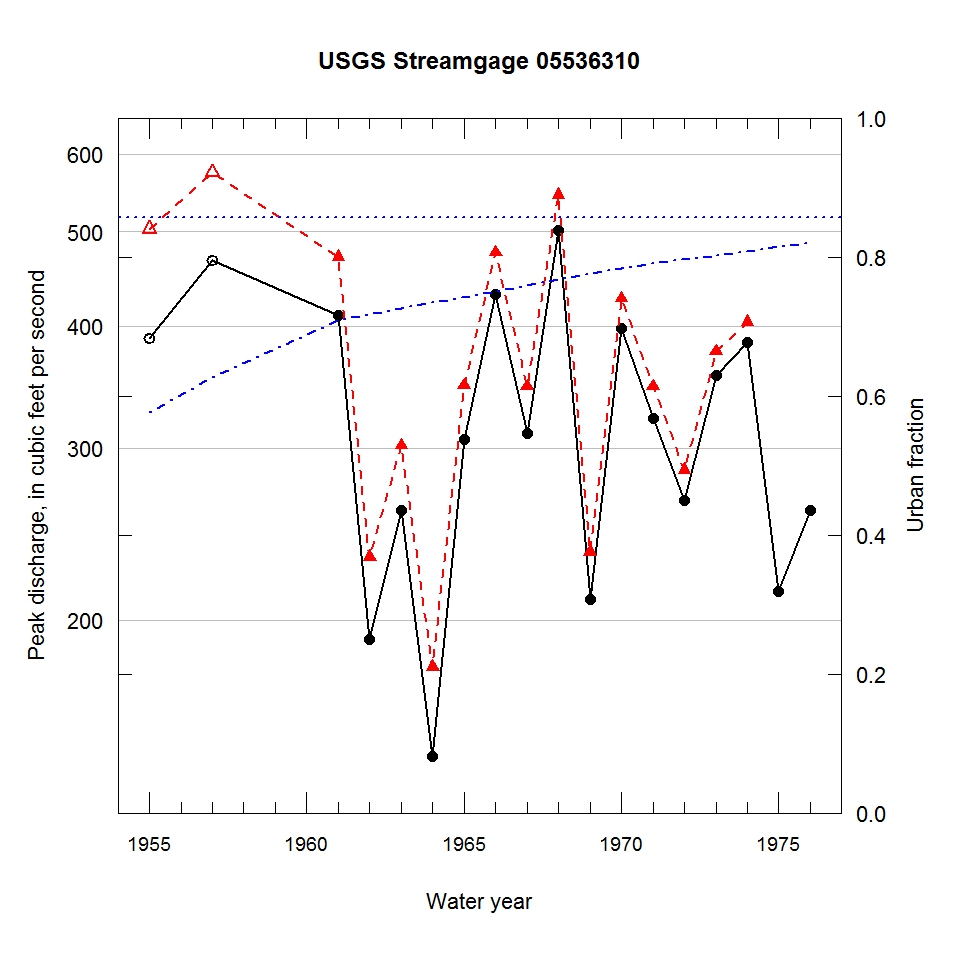
Observed and urbanization-adjusted annual maximum peak discharge and associated urban fraction and precipitation values at USGS streamgage:
05536310 CALUMET UNION DRAINAGE CANAL NEAR MARKHAM, IL


| Water year | Segment | Discharge code | Cumulative reservoir storage (acre-feet) | Urban fraction | Precipitation (inches) | Observed peak discharge (ft3/s) | Adjusted peak discharge (ft3/s) | Exceedance probability |
| 1955 | 1 | 7 | 0 | 0.577 | 3.513 | 389 | 503 | 0.163 |
| 1957 | 1 | 7 | 0 | 0.626 | 2.367 | 467 | 575 | 0.101 |
| 1961 | 1 | -- | 0 | 0.709 | 1.611 | 410 | 471 | 0.196 |
| 1962 | 1 | -- | 0 | 0.717 | 0.249 | 191 | 232 | 0.818 |
| 1963 | 1 | -- | 0 | 0.726 | 1.579 | 259 | 302 | 0.609 |
| 1964 | 1 | -- | 0 | 0.734 | 1.027 | 145 | 179 | 0.933 |
| 1965 | 1 | -- | 0 | 0.742 | 0.949 | 306 | 348 | 0.478 |
| 1966 | 1 | -- | 0 | 0.751 | 1.519 | 431 | 476 | 0.191 |
| 1967 | 1 | -- | 0 | 0.759 | 1.187 | 311 | 347 | 0.480 |
| 1968 | 1 | -- | 0 | 0.767 | 1.498 | 502 | 545 | 0.127 |
| 1969 | 1 | -- | 0 | 0.776 | 0.861 | 210 | 235 | 0.811 |
| 1970 | 1 | -- | 0 | 0.784 | 1.401 | 398 | 427 | 0.264 |
| 1971 | 1 | -- | 0 | 0.790 | 0.269 | 322 | 347 | 0.480 |
| 1972 | 1 | -- | 0 | 0.796 | 0.880 | 265 | 285 | 0.665 |
| 1973 | 1 | -- | 0 | 0.802 | 0.927 | 356 | 377 | 0.397 |
| 1974 | 1 | -- | 0 | 0.809 | 1.083 | 385 | 404 | 0.316 |
| 1975 | 0 | -- | 0 | 0.815 | 1.106 | 214 | -- | -- |
| 1976 | 0 | -- | 0 | 0.821 | 0.928 | 259 | -- | -- |

